cAdvisor内存占用不断飙升导致其在k8s内不断crash问题排查

背景

我们的额监控方案为:Kubernetes(K8S)+cAdvisor+Prometheus+Grafana。
然后,用cAdivor监控容器信息,其实,cAdivor其实到现在的主流K8S版本中,Kubelet进程已经将其内置了,但是我们没有这么用,因为没有必要因为让Prometheus定期去Kubelet上采集容器信息,平白增添对Kubelet的压力。相反,我觉得,还是应该还是应该单独部署cAdvisor,这样一来,不论是定制化cAdvisor,还是版本更新,都会更方面。所以,我使用DaemonSet部署了cAdvisor。

问题

用DaemonSet的方式部署cAdvisor,本质上,就是每个K8S的宿主机都启动了一个pod,实际观测,发现这些Pod的状态,会随着时间的推移,开始频繁出现Crash。这个问题,势必会导致cAdvisor无法正常监控容器信息。下面是具体的排查过程。

排查初探

首先,Pod Crash 必然有其原因,所以,一开始是通过下面的方式,看cAdvisor到底为何会Crash,通过

1
kubectl describe pod -n monitoring pod-xxxxx

找到Last State部分,发现其为:

1
State: OOMKilled

这说明,这个 Pod,是因为内存不够,cAdvisor在运行过程,超出了Pod的资源限制,被OOM杀掉了。既然资源不够,那么首先,就是调大其内存限制。

一开始为这个Pod设置的上限资源为1核CPU+1G内存,既然内存无法满足,那么调大为2G,继续观测,发现依然会OOM。然后又调整为3G、4G、10G、20G(机器内存大,土豪),发现虽然内存变大了会有一些缓解,但实际上,即使内存上限设置为20G,还是会有Crash的情况,那么,这时候就需要反思一下几个问题了:

  1. 是否是cAdvisor存在bug?
  2. 哪个机器上的cAdvisor Pod总是重启?
排查是否是cAdvisor版本问题

针对第一点,我们升级了cAdivor镜像为最新版,问题依旧。

排查是否是cAdvisor参数配置问题

google一些文章,有人提过类似的问题,官方issue的解释中,有人提到可能配置不对,可能采集的指标过多等,于是,我review了一下我的配置,调整后的完整配置如下:

1
2
3
4
5
6
7
8
9
10
11
12
13
14
15
16
17
18
19
20
21
22
23
24
25
26
27
28
29
30
31
32
33
34
35
36
37
38
39
40
41
42
43
44
45
46
47
48
49
50
51
52
53
54
55
56
57
58
59
60
61
62
63
64
65
66
67
68
69
70
71
72
73
74
75
76
77
78
79
80
81
82
83
84
85
86
87
88
89
90
91
92
93
94
95
96
97
apiVersion: extensions/v1beta1
kind: DaemonSet
metadata:
labels:
name: cadvisor
name: cadvisor
namespace: monitoring
spec:
revisionHistoryLimit: 10
selector:
matchLabels:
name: cadvisor
template:
metadata:
annotations:
prometheus.io/port: "28762"
prometheus.io/scrape: "true"
creationTimestamp: null
labels:
name: cadvisor
spec:
automountServiceAccountToken: false
containers:
- args:
- -allow_dynamic_housekeeping=true
- -global_housekeeping_interval=1m0s
- -housekeeping_interval=3s
- -disable_metrics=udp,tcp,percpu,sched
- -storage_duration=15s
- -profiling=true
- -port=28762
- -max_procs=1
image: mine/cadvisor-test:v0.0.2
imagePullPolicy: IfNotPresent
name: cadvisor
ports:
- containerPort: 28762
hostPort: 28762
name: http
protocol: TCP
resources:
limits:
cpu: "1"
memory: 3000Mi
requests:
cpu: "1"
memory: 500Mi
terminationMessagePath: /dev/termination-log
terminationMessagePolicy: File
volumeMounts:
- mountPath: /rootfs
name: rootfs
readOnly: true
- mountPath: /var/run
name: var-run
readOnly: true
- mountPath: /sys
name: sys
readOnly: true
- mountPath: /var/lib/docker
name: docker
readOnly: true
- mountPath: /dev/disk
name: disk
readOnly: true
dnsPolicy: ClusterFirst
hostNetwork: true
restartPolicy: Always
schedulerName: default-scheduler
securityContext: {}
terminationGracePeriodSeconds: 30
volumes:
- hostPath:
path: /
type: ""
name: rootfs
- hostPath:
path: /var/run
type: ""
name: var-run
- hostPath:
path: /sys
type: ""
name: sys
- hostPath:
path: /DATA/docker
type: ""
name: docker
- hostPath:
path: /dev/disk
type: ""
name: disk
templateGeneration: 6
updateStrategy:
rollingUpdate:
maxUnavailable: 1
type: RollingUpdate

我调整的部分主要集中在:

1
2
3
4
5
6
7
8
// 这个是禁用哪些指标,默认只有udp、tcp
- -disable_metrics=udp,tcp,percpu,sched
// 存储最近多久的数据,原来是1分多钟,调整为15s
- -storage_duration=15s
// 是否开启性能测试,默认为关闭,之所以开启,是要一会儿debug内存占用
- -profiling=true
// 使用多少CPU,默认不到1个
- -max_procs=1

上面的方式,是减少了一些采集指标,以及采集数据的最多保留时长,稍微有些效果,但是发现效果不大,原来某些机器上频繁Crash的cAdvisor Pod,还是Crash,另外某些机器上从来不Crash的,也不会Crash。那么,说明参数配置没什么用,问题应该出现某些机器上。

排查为何cAdivosr Pod在某些机器上Crash

我回顾了一下我们的K8S节点,发现cAdvisor Pod不OOM的机器上面,容器都比较少。越是容器多的机器,这机器上的cAdvisor Pod就越容易OOM Crash。

那么,我们看一下 cAdvisor 的 Pod 日志,发现其频繁报一个错误:

1
fsHandler.go:135] du and find on following dirs took 57.562700809s: [/rootfs/DATA/docker/overlay2/d8c002c4dc33c22129124e70bf7ca15fd312cd8867c040708d11d7d462ee58df/diff /rootfs/DATA/docker/containers/16eb9120ce2da24d867ee287c093ce7221f1d3ed39e69c3a8d128313a5dc0d63]; will not log again for this container unless duration exceeds 4s

这说明,cAdvisor会统计每一个容器占用的磁盘使用大小,这个大小是通过du命令来处理的,而且,这个统计耗费的时间很长。我们可以实际去看一下,发现这个目录,确实比较大,有些在2-3G。这说明,这个机器上,必然存在一些容器,里边在搞事情,写了很多的文件,导致 du 命令在统计的时候,比较耗时。

问题初步总结

K8S节点,有些容器存储或写入了比较多的文件,造成cAdvisor统计容器磁盘使用耗时,进而引发此cAdivosr内存占用升高。

排查深入探究

既然上面已经初步定为问题,但是我们依然会疑惑,为什么cAdivosr统计容器磁盘耗时会引发内存飙升呢?

我们需要借助一些工具来进一步排查

  1. 通过 go tool pprof 分析内存
  2. 通过查看 cAdvisor 源码分析流程
  3. 在源码中,打断点,验证猜想
通过 go tool pprof 分析内存

首先,将 DaemonSet 启动的 cAdvisor,使用 Host 模式启动,这样我们就可以直接通过访问宿主机上,cAdvisor开放的端口,来做性能采样了。

1
go tool pprof  -cum -svg -alloc_space http://x.x.x.x:28762/debug/pprof/heap

上面的步骤,会生成内存性能采样图,类似如下:
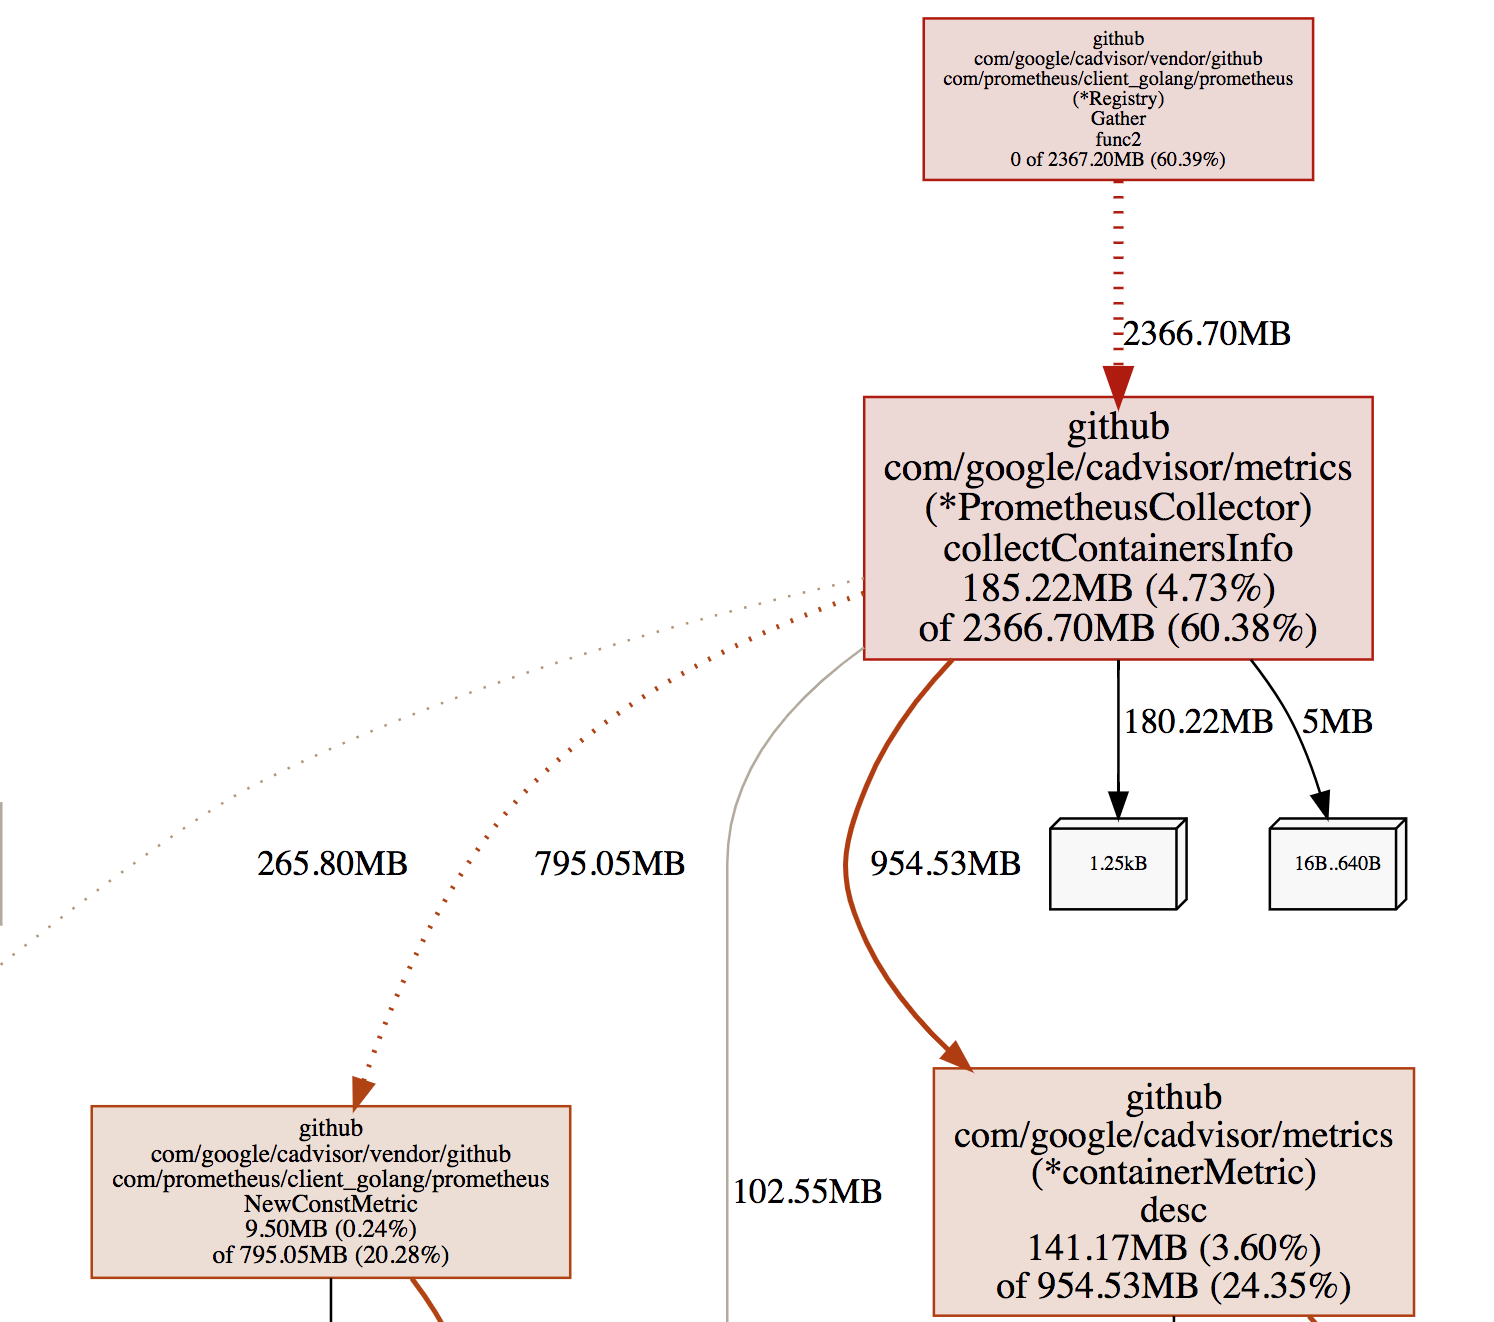
采样图

详细采样图,可以通过此连接查看:

采样图全

从图中,先看红色部分,颜色越深,表示这部分资源消耗越严重,我们这个采样图是采集的内存,可以看到,有 2366.70M,是 Gather 函数的,但其实,这个函数本身,并没有多少内存消耗,它的内存占用这么大,是 collectContainersInfo 函数分配的。其实不论怎样,Gather函数都脱离不了干系。那么,我们从源码看一下

源码分析

首先,入口函数main中,注册了/metrics对应的handler,因为cAdvisor要开发 /metirics路径,让 Prometheus 来定时采集

1
2
3
4
5
6
7
8
9
10
11
// cadvisor.go#82
func main() {
defer glog.Flush()
flag.Parse()
//注册HTTP路径 *prometheusEndpoint 值就是 /metirics
cadvisorhttp.RegisterPrometheusHandler(mux, containerManager, *prometheusEndpoint, containerLabelFunc, includedMetrics)
glog.V(1).Infof("Starting cAdvisor version: %s-%s on port %d", version.Info["version"], version.Info["revision"], *argPort)

addr := fmt.Sprintf("%s:%d", *argIp, *argPort)
glog.Fatal(http.ListenAndServe(addr, mux))
}

然后,看一下,是谁在处理 /metrics 路由对应的操作

1
2
3
4
5
6
7
8
9
10
11
12
// 代码文件:http/handler.go#97
func RegisterPrometheusHandler(mux httpmux.Mux, containerManager manager.Manager, prometheusEndpoint string,
f metrics.ContainerLabelsFunc, includedMetrics container.MetricSet) {
r := prometheus.NewRegistry()
r.MustRegister(
metrics.NewPrometheusCollector(containerManager, f, includedMetrics),
prometheus.NewGoCollector(),
prometheus.NewProcessCollector(os.Getpid(), ""),
)
//可以看到,真正执行 /metrics 的函数,是 promhttp.HandlerFor
mux.Handle(prometheusEndpoint, promhttp.HandlerFor(r, promhttp.HandlerOpts{ErrorHandling: promhttp.ContinueOnError}))
}

可以看到,真正执行 /metrics 的函数,是promhttp.HandlerFor,具体深入HandlerFor看一下

1
2
3
4
5
6
7
8
// 代码文件:vendor/github.com/prometheus/client_golang/prometheus/promhttp/http.go#82
func HandlerFor(reg prometheus.Gatherer, opts HandlerOpts) http.Handler {
return http.HandlerFunc(func(w http.ResponseWriter, req *http.Request) {
//这里就是真正的 Gather 调用
mfs, err := reg.Gather()
...
})
}

至此,可以说明,每一次HTTP调用(调用 x.x.x.x:8080/metrics),都会又一次Gather调用。

所以我们猜想,之所以Gather函数有这么大的内存占用,主要是因为Gather函数调用次数多,而每次Gather函数执行之间长,导致形成了并发调用,这种情况下,Gather函数从执行到结束期间,都不会释放内存,并发调用,就会导致内存积压。

修改源码,重新构建部署,验证猜想

那么,我们在Gather调用处,打断点,看一下执行时间:

1
2
3
4
5
6
7
8
9
10
11
12
// 代码文件:vendor/github.com/prometheus/client_golang/prometheus/promhttp/http.go#82
func HandlerFor(reg prometheus.Gatherer, opts HandlerOpts) http.Handler {
return http.HandlerFunc(func(w http.ResponseWriter, req *http.Request) {
pp.Println("请求开始————————")
start:=time.Now()
//这里就是真正的 Gather 调用
mfs, err := reg.Gather()
...
timeCost := time.Since(start)
pp.Println(fmt.Sprintf("请求结束,耗时 %v", timeCost))
})
}

我们打印了Gather执行的耗时,然后重新构建 cAdvisor源码,打一个私有镜像出来,推送到私有镜像仓库。然后我们使用这个测试镜像,重新部署cAdvisor。

现在,我们挑一台之前cAdvisor频发OOM Crash的机器,看一下它的log

1
kubectl logs -n monitoring cadvisor-k9kpt -f

日志输出大致如下:

1
2
3
4
5
6
"请求开始————————"
I1023 14:21:19.126794 1 fsHandler.go:135] du and find on following dirs took 15.420205027s: [/rootfs/var/lib/docker/overlay2/67ec1868b2c0ed5ce5b22ee014eb4d08993accd68546a3de6aa2a6355bdc1a78/diff /rootfs/var/lib/docker/containers/cd910753386b3325af8bd5a69fc01b261ca14c1bfaf754677662e903b755d34f]; will not log again for this container unless duration exceeds 56s
I1023 14:21:19.305938 1 fsHandler.go:135] du and find on following dirs took 15.278733582s: [/rootfs/var/lib/docker/overlay2/10621b60f26962cb1a90d7a7dc1ce4e3c8a15f6e4e30861b8433c5c37727bb9e/diff /rootfs/var/lib/docker/containers/b2a4d11c37aa9c63b4759c5728956253fad46fa174c7fe4d91336a4ac7532127]; will not log again for this container unless duration exceeds 1m34s
I1023 14:21:19.827757 1 fsHandler.go:135] du and find on following dirs took 13.897447077s: [/rootfs/var/lib/docker/overlay2/29b3b0dfc22053937e9c40e004a6d31af489573ff3a385020feb22d88d1a3d0a/diff /rootfs/var/lib/docker/containers/af962971a0643418d28c03b374e31a0c58dd6302524ea06dc8a23c4eccf5d663]; will not log again for this container unless duration exceeds 1m20s
I1023 14:21:20.042949 1 fsHandler.go:135] du and find on following dirs took 14.514122984s: [/rootfs/var/lib/docker/overlay2/27f1d3cb3d421567754cb7abb986c16c3f3bec0874e983a2604aa7eda8834d9a/diff /rootfs/var/lib/docker/containers/60cad8688e31b557e2e98c47beaa1f3af2ea2e6cbfab0c1f399887b3eecec86c]; will not log again for this container unless duration exceeds 1m56s
"请求结束,耗时 58.093771464s"

日志其实我只是截图了一部分,基本上可以看出来,Gather请求十分耗时,这个耗时,就是由 du 操作耗时造成的,有时候,du 耗时非常严重,能将近2分钟。

这样,基本上,就印证了,Gather函数处理慢,而Prometheus每隔3s请求一次,造成同时有非常多的 Gather函数在并发处理,也就导致了内存积压的情况。

彻底解决

综上,其实我们只需要让 du 磁盘统计快了就可以了,du 的快慢,是一个CPU密集和磁盘IO密集的操作,要加快 du 操作,就需要给到足够的运算能力。

回顾之前我们的 cAdvisor 的 DaemonSet 的yaml配置,我们在资源的 limit 部分,仅给到了一个 CPU,我们加 CPU 核数增加到6。如下:

1
2
3
4
5
6
7
resources:
limits:
cpu: "6"
memory: 3000Mi
requests:
cpu: "2"
memory: 500Mi

然后,更新 DaemonSet 部署

1
kubectl apply -f cadvisor.ds.yaml

再次去观察 cAdvisor 的pod日志,发现du耗时明显缩短到2秒钟以内,pod内存占用过高的情况,再也没有出现过。问题得解!

Donate comment here